Depression is one of the most common mood disorders, and many studies have shown that depression affects the function of different brain regions, and that the symptoms exhibited by depression are related to neural network transmission disorders. Interestingly, some patients with depression spontaneously resolve without any treatment. The electroencephalogram (EEG) signal is the most direct indicator reflecting the signal connection and transmission of human or animal brain, and the EEG data of abnormal connection in the brain neural network is used as a marker for the treatment of depression. However, the relationship between functional connectivity and spontaneous remission of depression is still poorly understood. At the same time, EEG research on neural network signaling for spontaneous relief of depression has not been reported so far. Therefore, today I share a research paper from BMC Neuroscience that highlights the electrophysiological mechanisms of spontaneous relief of depression using mutual proof of behavioral and rodent EEG .


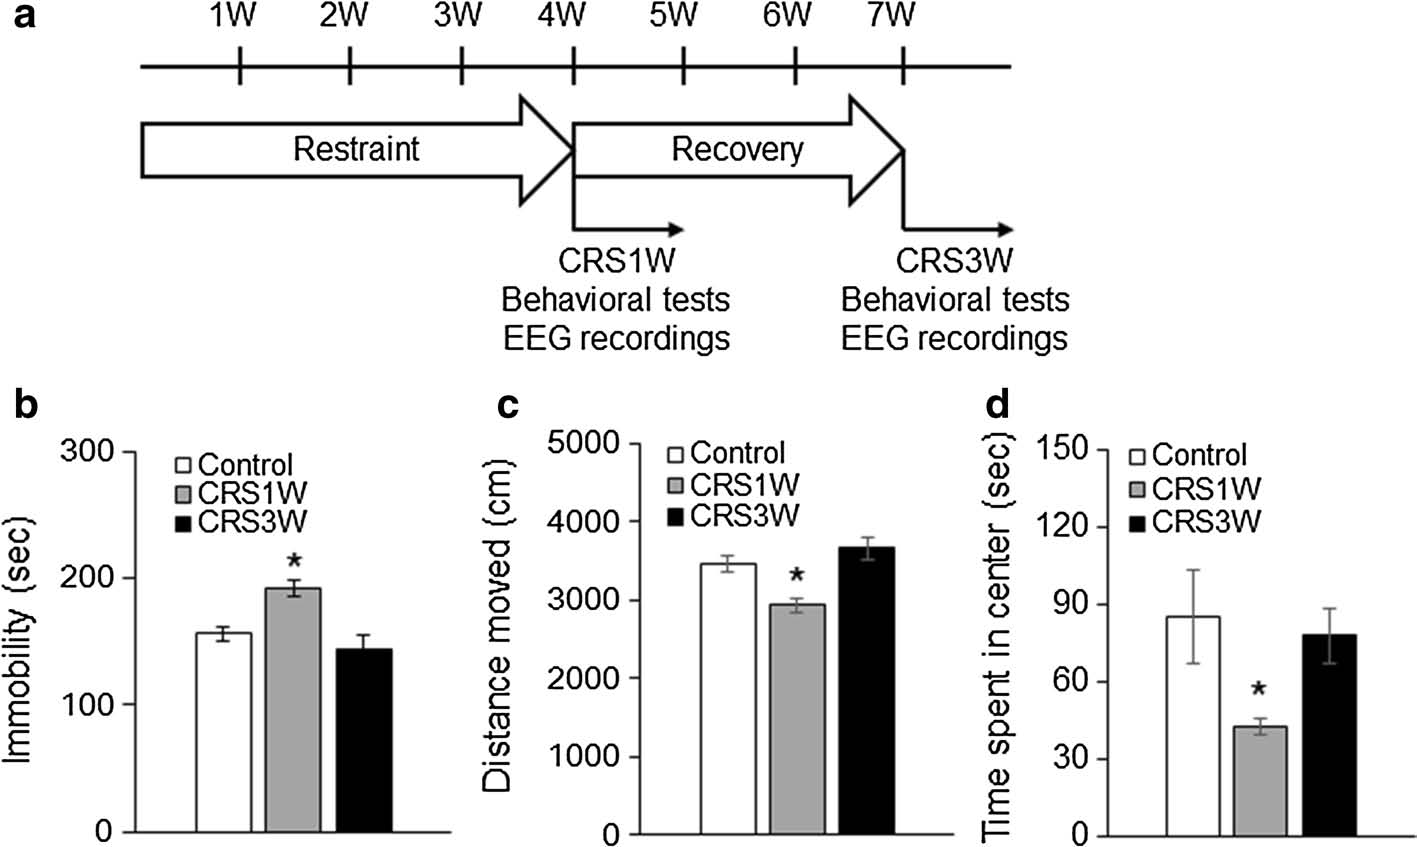
Figure 1 Spontaneous recovery of depression-like behavior
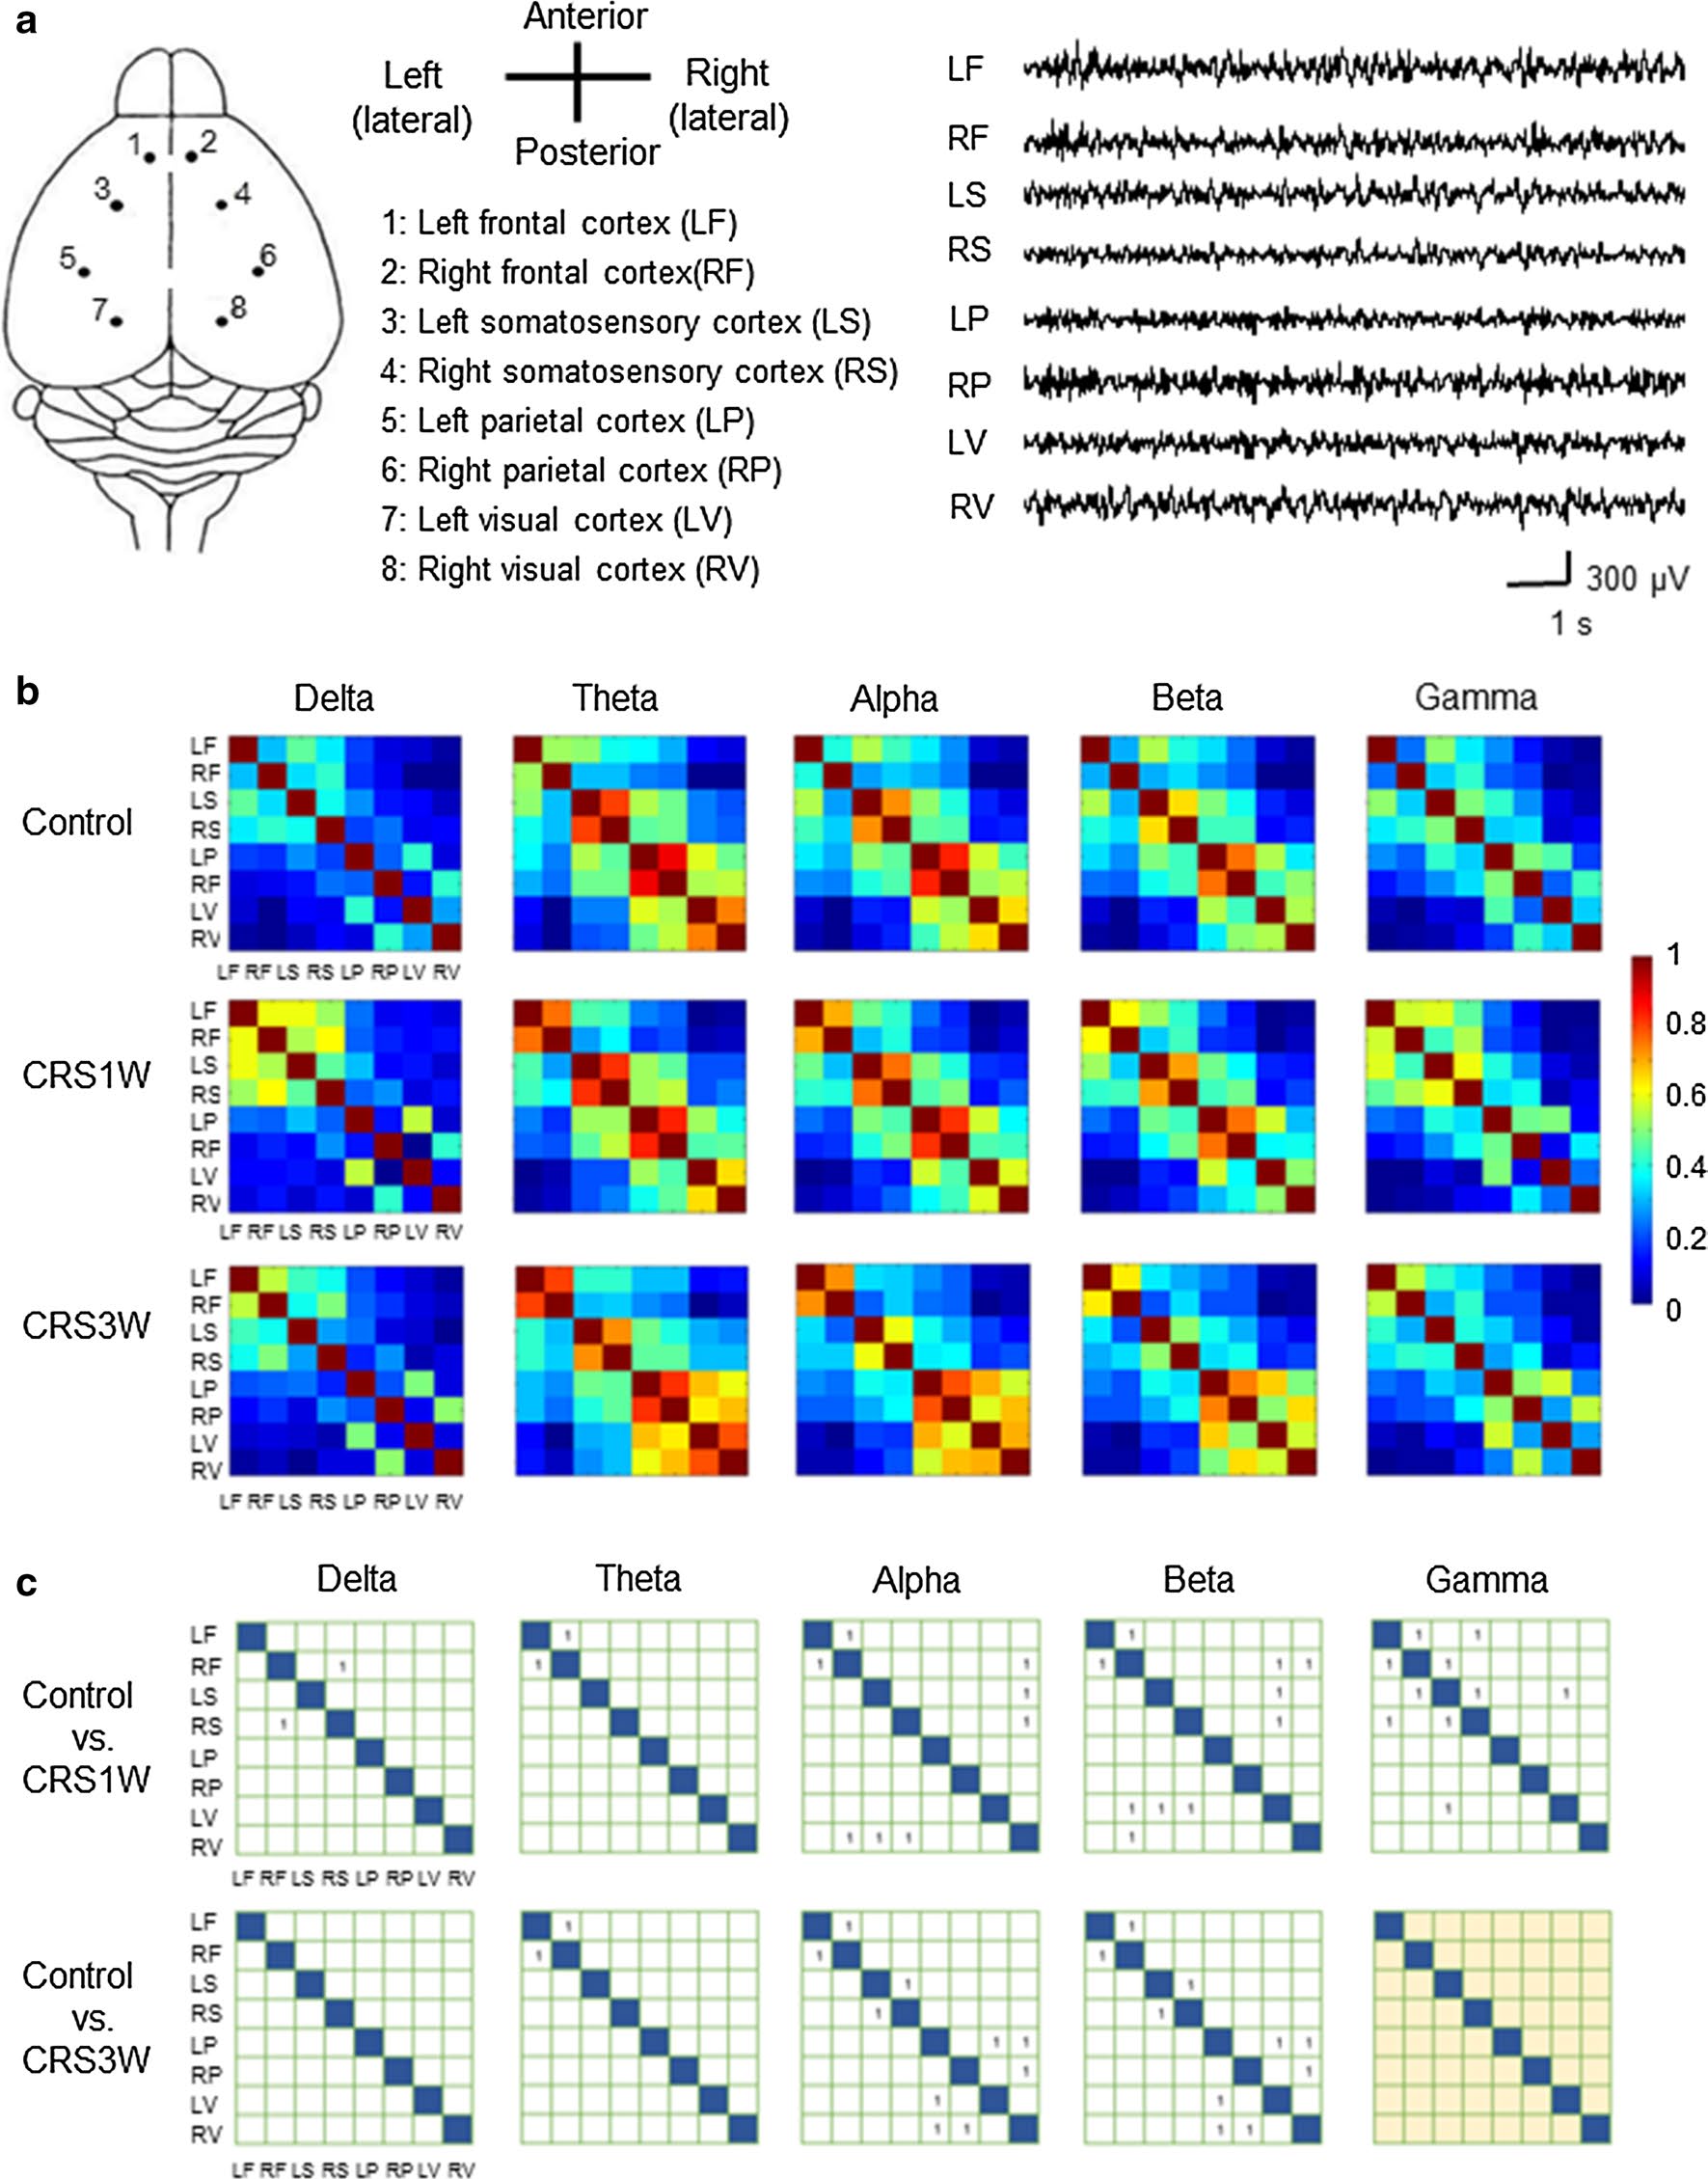
2. EEG signals were recorded from 8 brain regions of CRS1W group and CRS3W group, and regional EEG activity was analyzed (Fig. 2a). Cross-correlation analysis was performed on left and right hemispheres (Fig. 2b). In comparison, the CRS1W group increased the correlation coefficient values ​​for all bands in many different regions (Fig. 2c). However, in the CRS3W group, all differences in the δ and γ bands observed between the control group and the CRS1W group were not detected (Fig. 2c). This shows that after 3 weeks of CRS3 W group, some of the nerve connection interruption functions have returned to normal.

Figure 2 Cross-correlation analysis
There are many models of depression in current research, such as Learned helplessness, chronic unpredictable mild stress, social defeat stress, and chronic restraint stress. Model (chronic restraint stress) and so on. The ideal animal model of depression should satisfy three things in common: (1) whether face validity stress can cause depression-like behavior changes in animals, which is the theoretical basis for measuring behavioral experiments; Construct validity, whether the cause of behavior is consistent with patients with depression; (3) predictive validity, whether common antidepressants can reverse the change of depression-like phenotype caused by stress This is also the theoretical source of the experimental design positive control group. Each model has its theoretical basis, has been proven, the model is successful or not, through specific behavioral experiments, common elevated cross maze experiments (detecting anxiety), open field experiments (detecting athletic activities, and exploring Ability), forced swimming experiments (rats and mice, abandoning behavior) and tail-hanging experiments (mouse, abandoning behavior), as well as water maze experiments to measure learning and memory, and social interaction experiments of social activities. Nodas Information Technology Co., Ltd. specializes in behavioral research for more than 20 years. Ethovison, an independently developed animal trajectory tracking system, can track any motion trajectory in plane or 3D space, and can automatically recognize automatic in the specific experimental environment. Track and conduct all of the above experiments.
At the same time, modern scientific research shows that when the human brain works, it will spontaneously produce an electrochemical reaction. These physiological activities are expressed in the form of brain currents. In the study of EEG, brain waves have different bands, and different bands have different meanings. γ nerve oscillation is a kind of high-frequency wave with a frequency between 30-100HZ, which exists in various regions of animals and human brain, such as the olfactory bulb. The thalamus, somatosensory cortex and hippocampus can be detected at all scales.
Â
Â

Â
In the article, the authors used the EEG signal of the mouse depression model induced by CRS for 1 week or 3 weeks to study the neural network brain activity of the eight brain regions of the left and right hemifront prefrontal cortex, somatosensory cortex, parietal cortex and visual cortex. The behavior data was automatically recorded and analyzed using Ethovision software (Noldus Information Technology, Wageningen, Netherlands), and the EEG data was mutually verified. All results are as follows:
1. CRS-induced behavioral abnormalities spontaneously recovered in the post-CRS period (3 weeks). After 1 week (CRS1W group) and 3 weeks (CRS3W group) (Fig. 1A), forced swimming test (FST) and open field experiment (OFT) were performed. In the FST, the CRS1 W group was significantly higher than the control group (191.76±6.27 vs. 155.82±6.20 s, p<0.05, Figure 1b), while the CRS3W group immobility time (144.40±10.83 s) returned to the control group. Level. In OFT, the CRS1W group had a smaller movement distance compared with the control group (2929.67±115.75 vs. 3415.68±113.16s; Mann-Whitney U-test p<0.05, Fig. 1c), and the central zone residence time was short (42.67±3.39 vs. 84.42 ± 12.26 s; Mann-Whitney U-test p < 0.05, Figure 1d). However, the CRS3 W group moving distance (3664.45 ± 278.77 s) (Fig. 1c) and the central zone dwell time (77.65 ± 10.76 s) (Fig. 1d) returned to the control level.
1. CRS-induced behavioral abnormalities spontaneously recovered in the post-CRS period (3 weeks). After 1 week (CRS1W group) and 3 weeks (CRS3W group) (Fig. 1A), forced swimming test (FST) and open field experiment (OFT) were performed. In the FST, the CRS1 W group was significantly higher than the control group (191.76±6.27 vs. 155.82±6.20 s, p<0.05, Figure 1b), while the CRS3W group immobility time (144.40±10.83 s) returned to the control group. Level. In OFT, the CRS1W group had a smaller movement distance compared with the control group (2929.67±115.75 vs. 3415.68±113.16s; Mann-Whitney U-test p<0.05, Fig. 1c), and the central zone residence time was short (42.67±3.39 vs. 84.42 ± 12.26 s; Mann-Whitney U-test p < 0.05, Figure 1d). However, the CRS3 W group moving distance (3664.45 ± 278.77 s) (Fig. 1c) and the central zone dwell time (77.65 ± 10.76 s) (Fig. 1d) returned to the control level.

Figure 1 Spontaneous recovery of depression-like behavior
2. EEG signals were recorded from 8 brain regions of CRS1W group and CRS3W group, and regional EEG activity was analyzed (Fig. 2a). Cross-correlation analysis was performed on left and right hemispheres (Fig. 2b). In comparison, the CRS1W group increased the correlation coefficient values ​​for all bands in many different regions (Fig. 2c). However, in the CRS3W group, all differences in the δ and γ bands observed between the control group and the CRS1W group were not detected (Fig. 2c). This shows that after 3 weeks of CRS3 W group, some of the nerve connection interruption functions have returned to normal.

Figure 2 Cross-correlation analysis
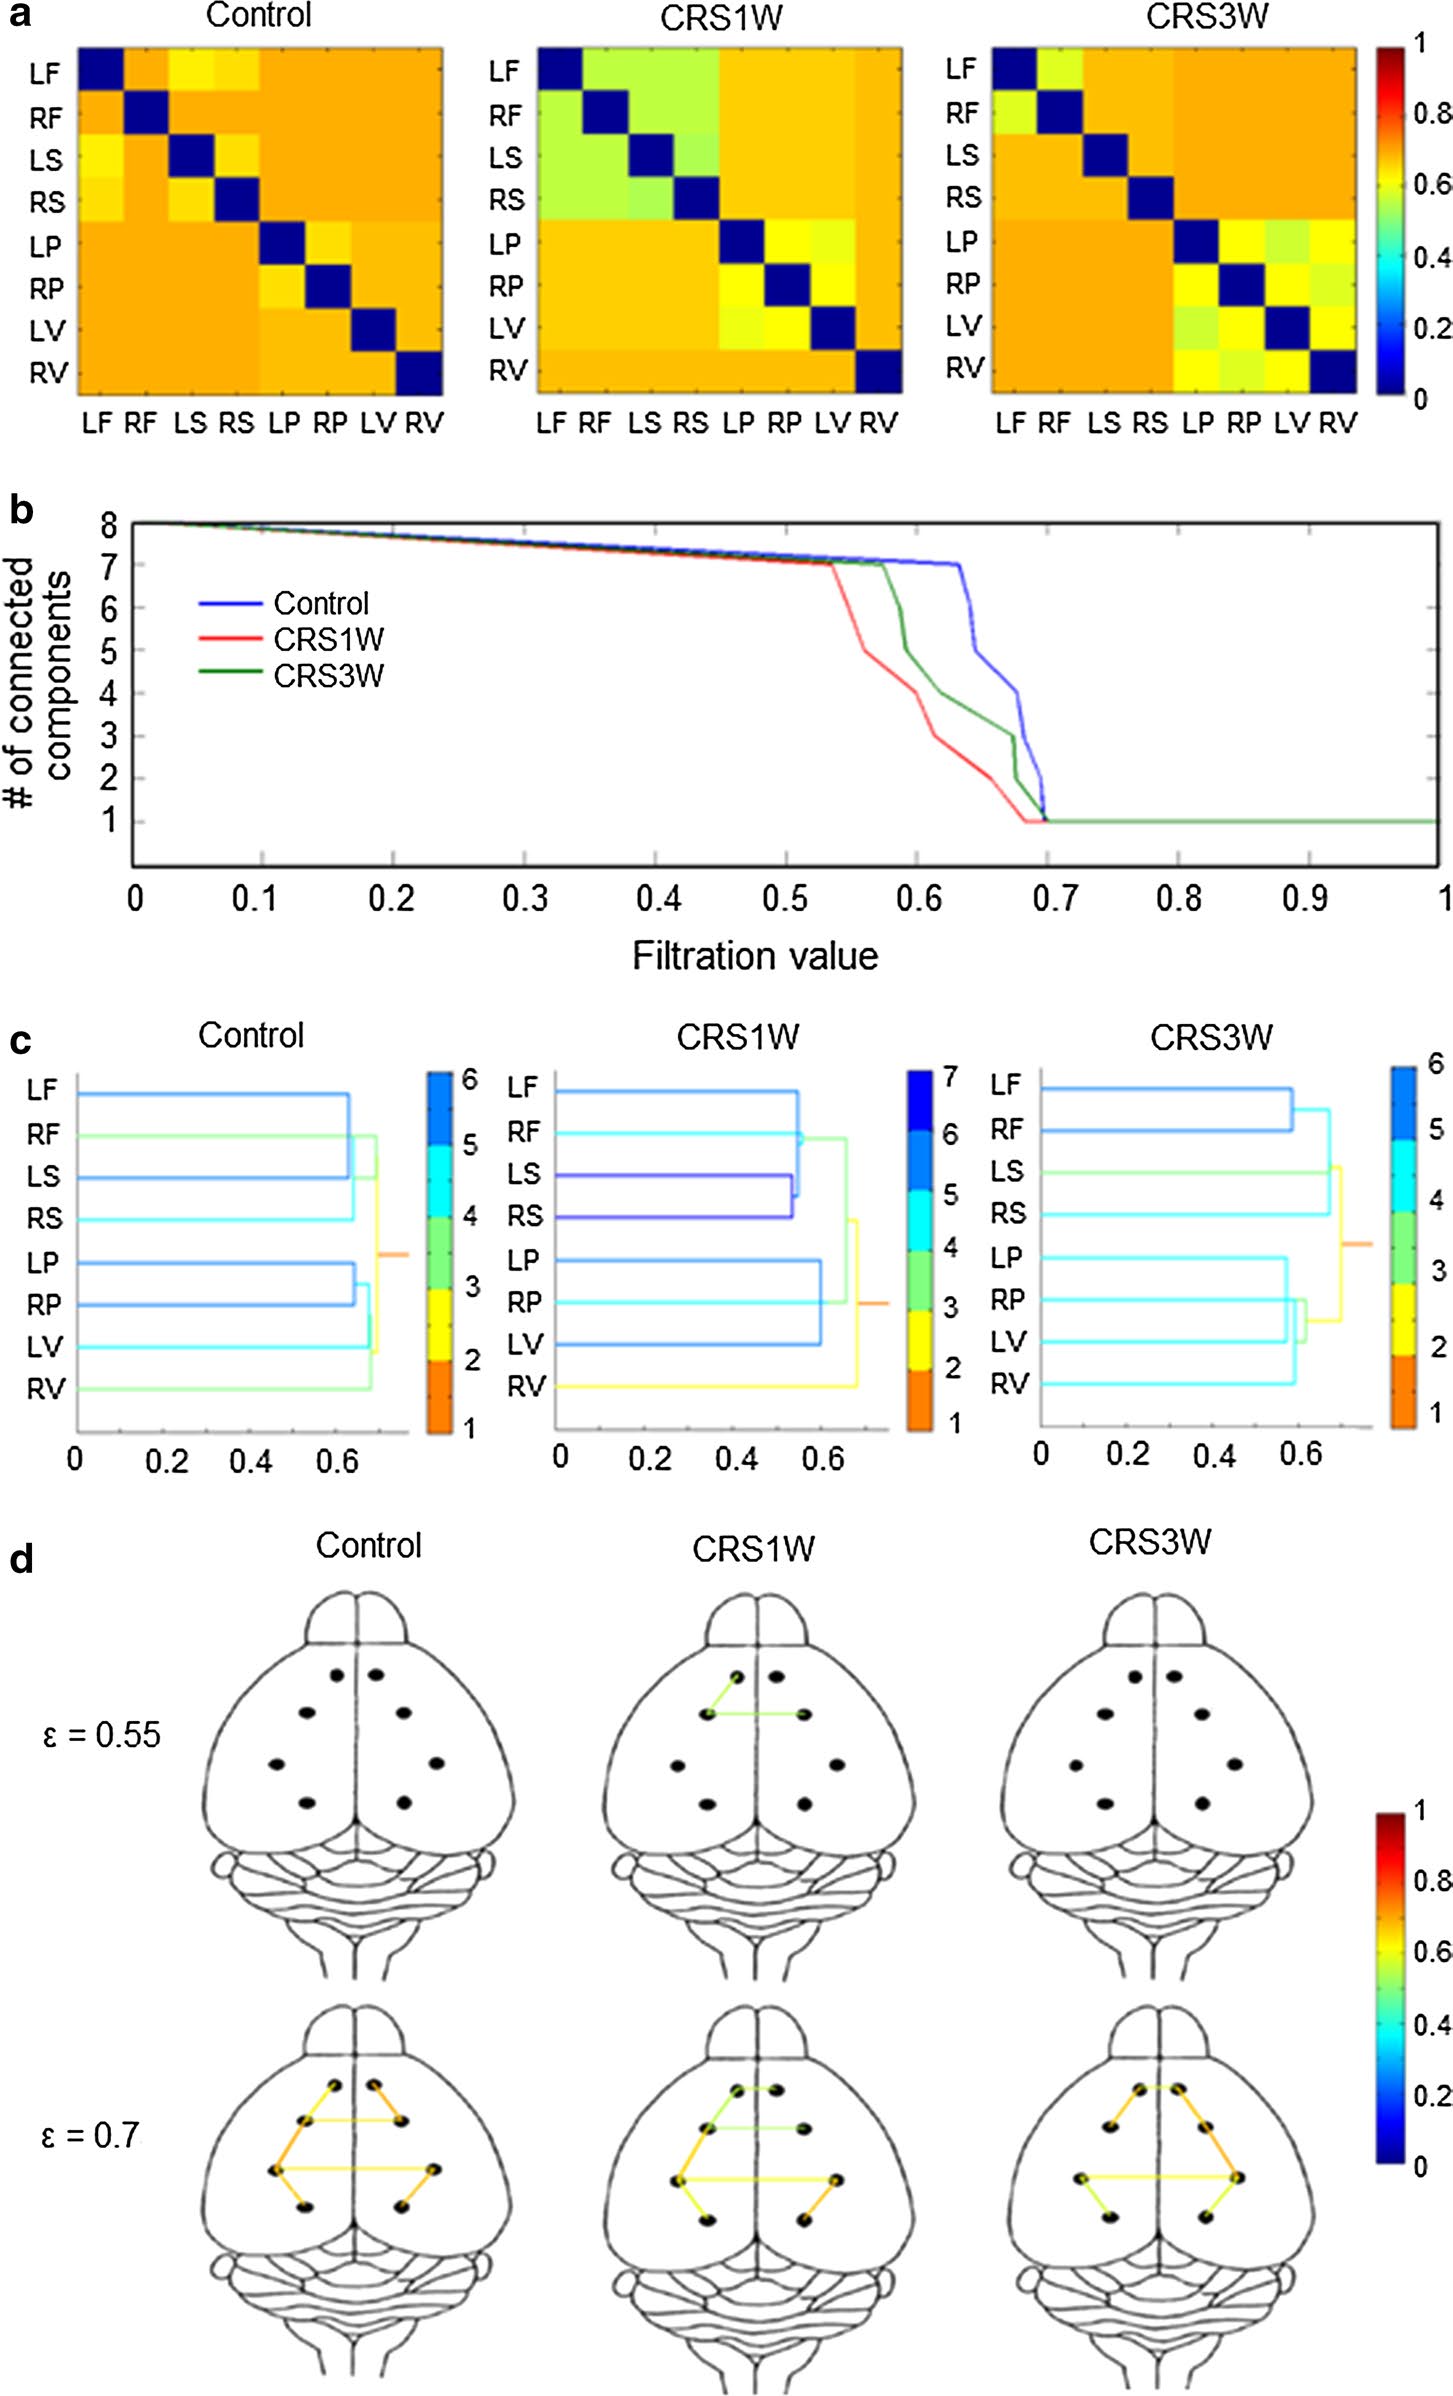
3. Down, use multi-scale neural network analysis to do continuous homology analysis of brain networks, and study EEG signal transmission at the network level. The single-joint matrix showed that the CRS1W group had a functional distance decrease on brain waves of different frequency bands compared with the control group, indicating an increase in functional connectivity in the CRS1W group. The reduction distance of the θ, α and β bands in the CRS1W group was not restored in the CRS3W group. However, it is exciting that the difference in the gamma band between the control group and the CRS3W group disappeared (Fig. 3a). This shows that after 3 weeks of CRS3 W group, brain waves in the gamma band are related to spontaneous remission.
4. It is not enough to know that spontaneous spontaneous mitigation is related to brainwaves in the gamma-band. It is still necessary to verify the network signal transmission in the final step. Using the evolutionary neural network coding and hierarchical clustering map generated by γ-oscillation waves, the CRS1W group (ε=0.6827) had lower final filtering values ​​than the control group (ε=0.6971), indicating an increase in the overall connectivity of the neural network. However, the neural network evolution in the CRS3W group was significantly restored to the control level, and the final filter values ​​in the two groups were similar to CRS3W, ε = 0.700) (Fig. 3b). The dendrogram results of sub-network hierarchical clustering showed that the functional distance between the somatosensory and frontal cortex of the CRS1W group was significantly reduced, while the CRS3W group was not. The color of the line in the figure indicates the distance from each connected component to the final component that is connected to all areas (Figure 3c). In the brain-connected network map, the association between the somatosensory and frontal cortex of the CRS1W group at ε=0.55 disappeared. At ε=0.75, the functional distance between the somatosensory cortex and the frontal cortex was reduced (functional connectivity was increased) in the CRS1W group compared with the control group, and the CRS3W group returned to normal. Different color bars represent different intensities of functional distances (Figure d).
4. It is not enough to know that spontaneous spontaneous mitigation is related to brainwaves in the gamma-band. It is still necessary to verify the network signal transmission in the final step. Using the evolutionary neural network coding and hierarchical clustering map generated by γ-oscillation waves, the CRS1W group (ε=0.6827) had lower final filtering values ​​than the control group (ε=0.6971), indicating an increase in the overall connectivity of the neural network. However, the neural network evolution in the CRS3W group was significantly restored to the control level, and the final filter values ​​in the two groups were similar to CRS3W, ε = 0.700) (Fig. 3b). The dendrogram results of sub-network hierarchical clustering showed that the functional distance between the somatosensory and frontal cortex of the CRS1W group was significantly reduced, while the CRS3W group was not. The color of the line in the figure indicates the distance from each connected component to the final component that is connected to all areas (Figure 3c). In the brain-connected network map, the association between the somatosensory and frontal cortex of the CRS1W group at ε=0.55 disappeared. At ε=0.75, the functional distance between the somatosensory cortex and the frontal cortex was reduced (functional connectivity was increased) in the CRS1W group compared with the control group, and the CRS3W group returned to normal. Different color bars represent different intensities of functional distances (Figure d).
Â
Finally, it is concluded that the gamma-band oscillations of the bilinear correlation and multiscale brain networks are involved in the spontaneous remission of depression-related behavior, and the signals of these gamma oscillations are associated with functional network connections between somatosensory and frontal cortex. Neurons involved in gamma oscillations simultaneously adjust their discharges with high precision, giving time integration. Therefore, gamma oscillations promote communication between neurons and play a key role in cortical integration and perception/cognition, providing new research ideas for the pathophysiological mechanisms of depression.

Â
Figure 3: Research on neural network discovery of gamma-band using persistent network topology
Industrial Microscope
Industrial Microscope,Inspection Binocular Microscope,Industrial Binocular Microscopes,Long Working Distance Microscopes
NINGBO VANCO INSTRUMENT CO.,LTD , https://www.vancoscope.com